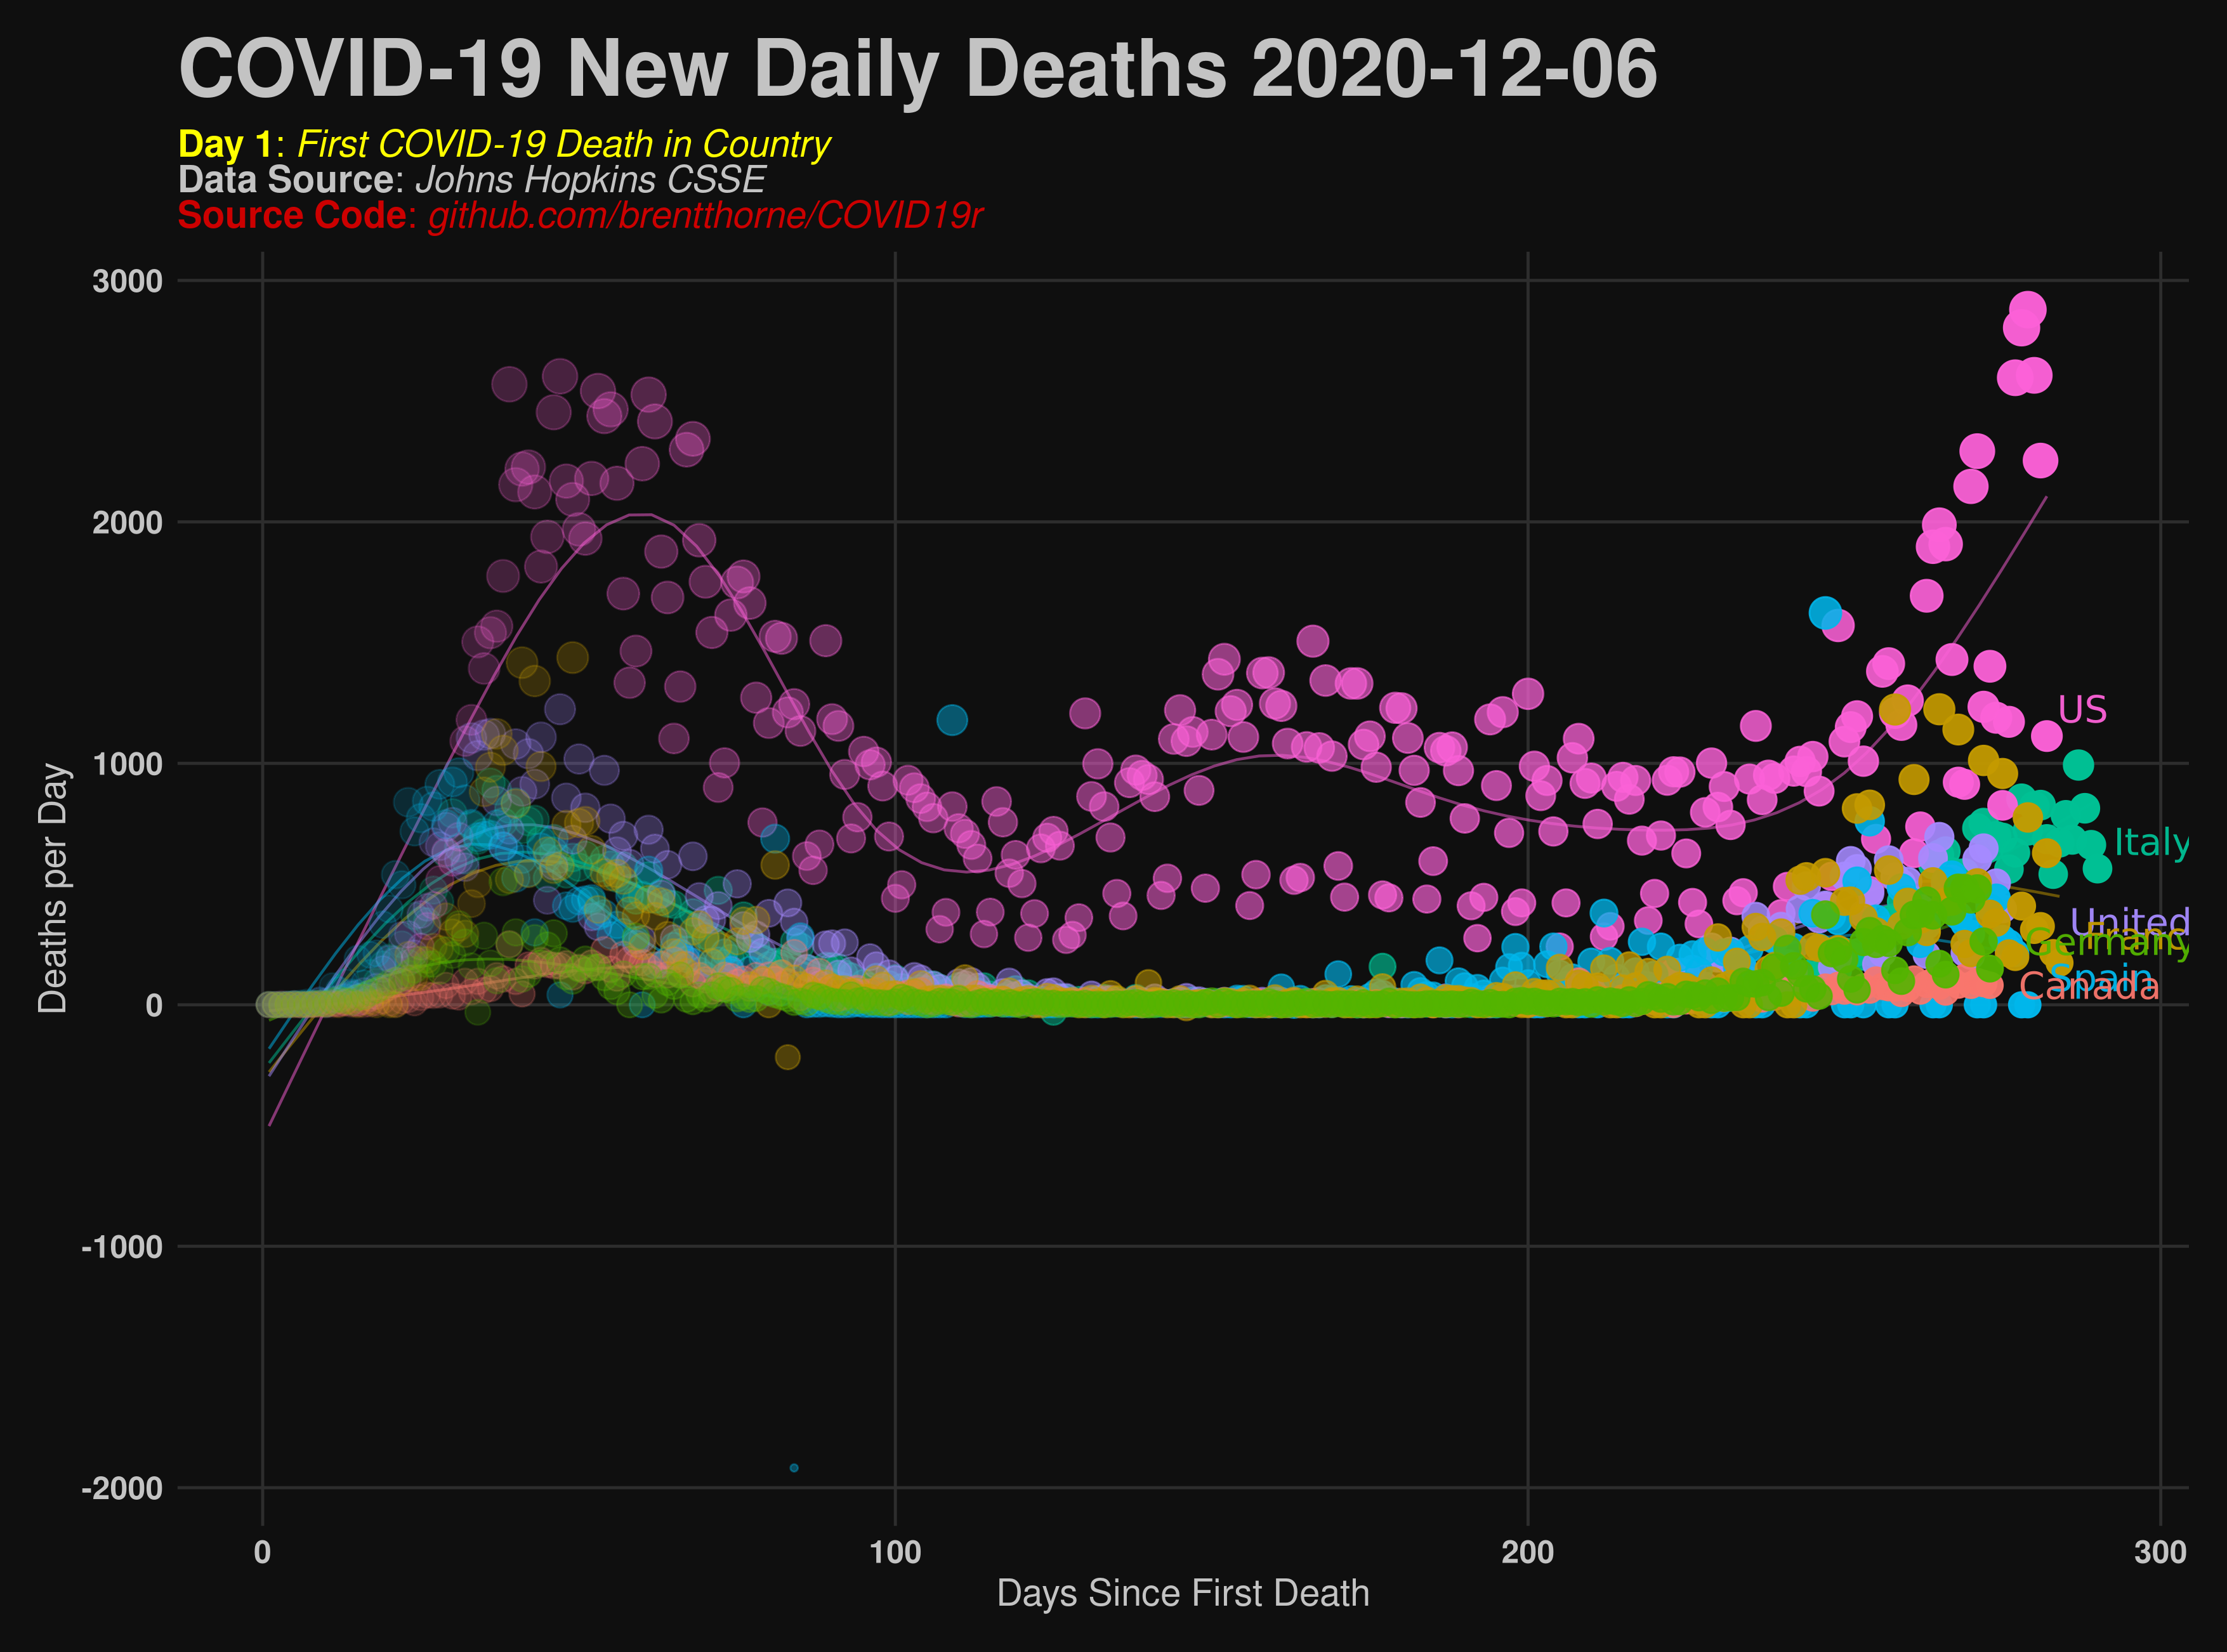
This repo is focused on reformatting the data provided by Johns Hopkins CSSE. Currently the data is filled as "wide" (meaning every new day gets a new column) where many users have expressed interest of wanting this data to be "long" or row based. I have written an R script which takes the time series data for Deaths, Confirmed Cases, and Recovered cases and converts the formatting to long form. In addition, I have fomatted the Date columns and added a *_Daily column for each of the three categories.
Origional template (Deaths only):
| Province/ State | Country/ Region | Lat | Long | 1/22/20 | 1/23/20 | ... | 3/18/20 |
|---|---|---|---|---|---|---|---|
| British Columbia | Canada | 49.2827 | -123.1207 | 0 | 0 | ... | 4 |
New Version (Deaths, Confirmed, and Recovered):
| ProvState | Country | Lat | Long | Date | Deaths_Total | Deaths_Daily | Confirmed_Total | Confirmed_Daily | Recovered_Total | Recovered_Daily |
|---|---|---|---|---|---|---|---|---|---|---|
| British Columbia | Canada | 49.2827 | -123.1207 | 2020-03-16 | 4 | 3 | 103 | 30 | 4 | 0 |
| British Columbia | Canada | 49.2827 | -123.1207 | 2020-03-17 | 4 | 0 | 103 | 0 | 4 | 0 |
| British Columbia | Canada | 49.2827 | -123.1207 | 2020-03-18 | 7 | 3 | 186 | 83 | 4 | 0 |
For the full csv of the combined data see here.
Here are examples of automated graphs comparing various countries to Italy made using this data using this R script:

