tvBOT showed significant advantages in tree annotation compared with other tools. First, it is highly efficient in data preparation, without the requirment of redundant data such as style data. Tree annotation in tvBOT is powered by a data-driven engine that only requires effective data organized in uniform formats saved as one Microsoft Excel sheet, TSV, or CSV file. A layer manager is developed to manage annotation dataset layers, allowing the addition of a specific layer by selecting the columns of the corresponding annotation data file. These characteristics reduce the learning cost and improve the data preparation efficiency. Second, it renders style adjustments in real-time and diversified ways. All style adjustments related to each annotation dataset can be executed on a highly interactive user interface, also available for mobile devices. In response to adjusting style parameters, the display engine allows the update and rendering of the changes in real time. In addition, tvBOT supports the combination display of 25 annotation dataset types to achieve multiple formats for tree annotations. It is open to all users and freely available at: https://www.chiplot.online/tvbot.html.
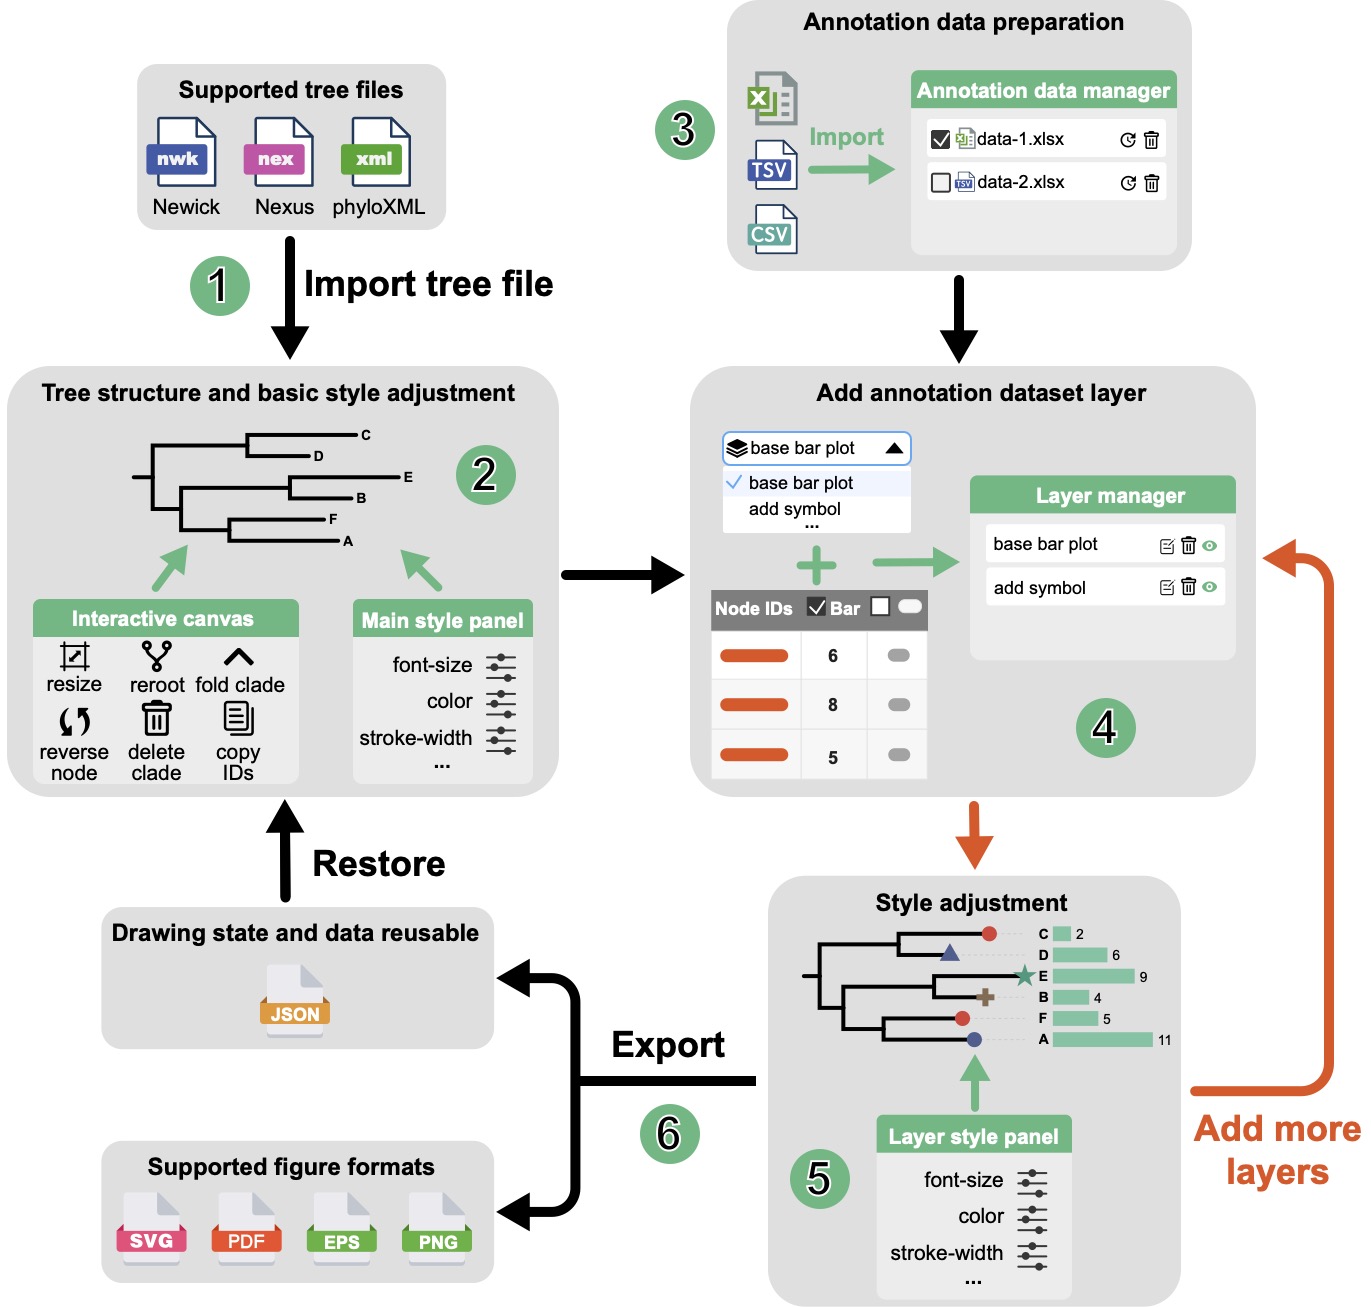
- (1) Import a tree file in various formats.
- (2) Adjust the tree structure and basic styles.
- (3) Organize annotation data in one or multiple tables and upload.
- (4) Add annotation dataset layers using corresponding data columns.
- (5) Execute style adjustments for each annotation dataset layer.
- (6) Export figure and save drawing state.
-
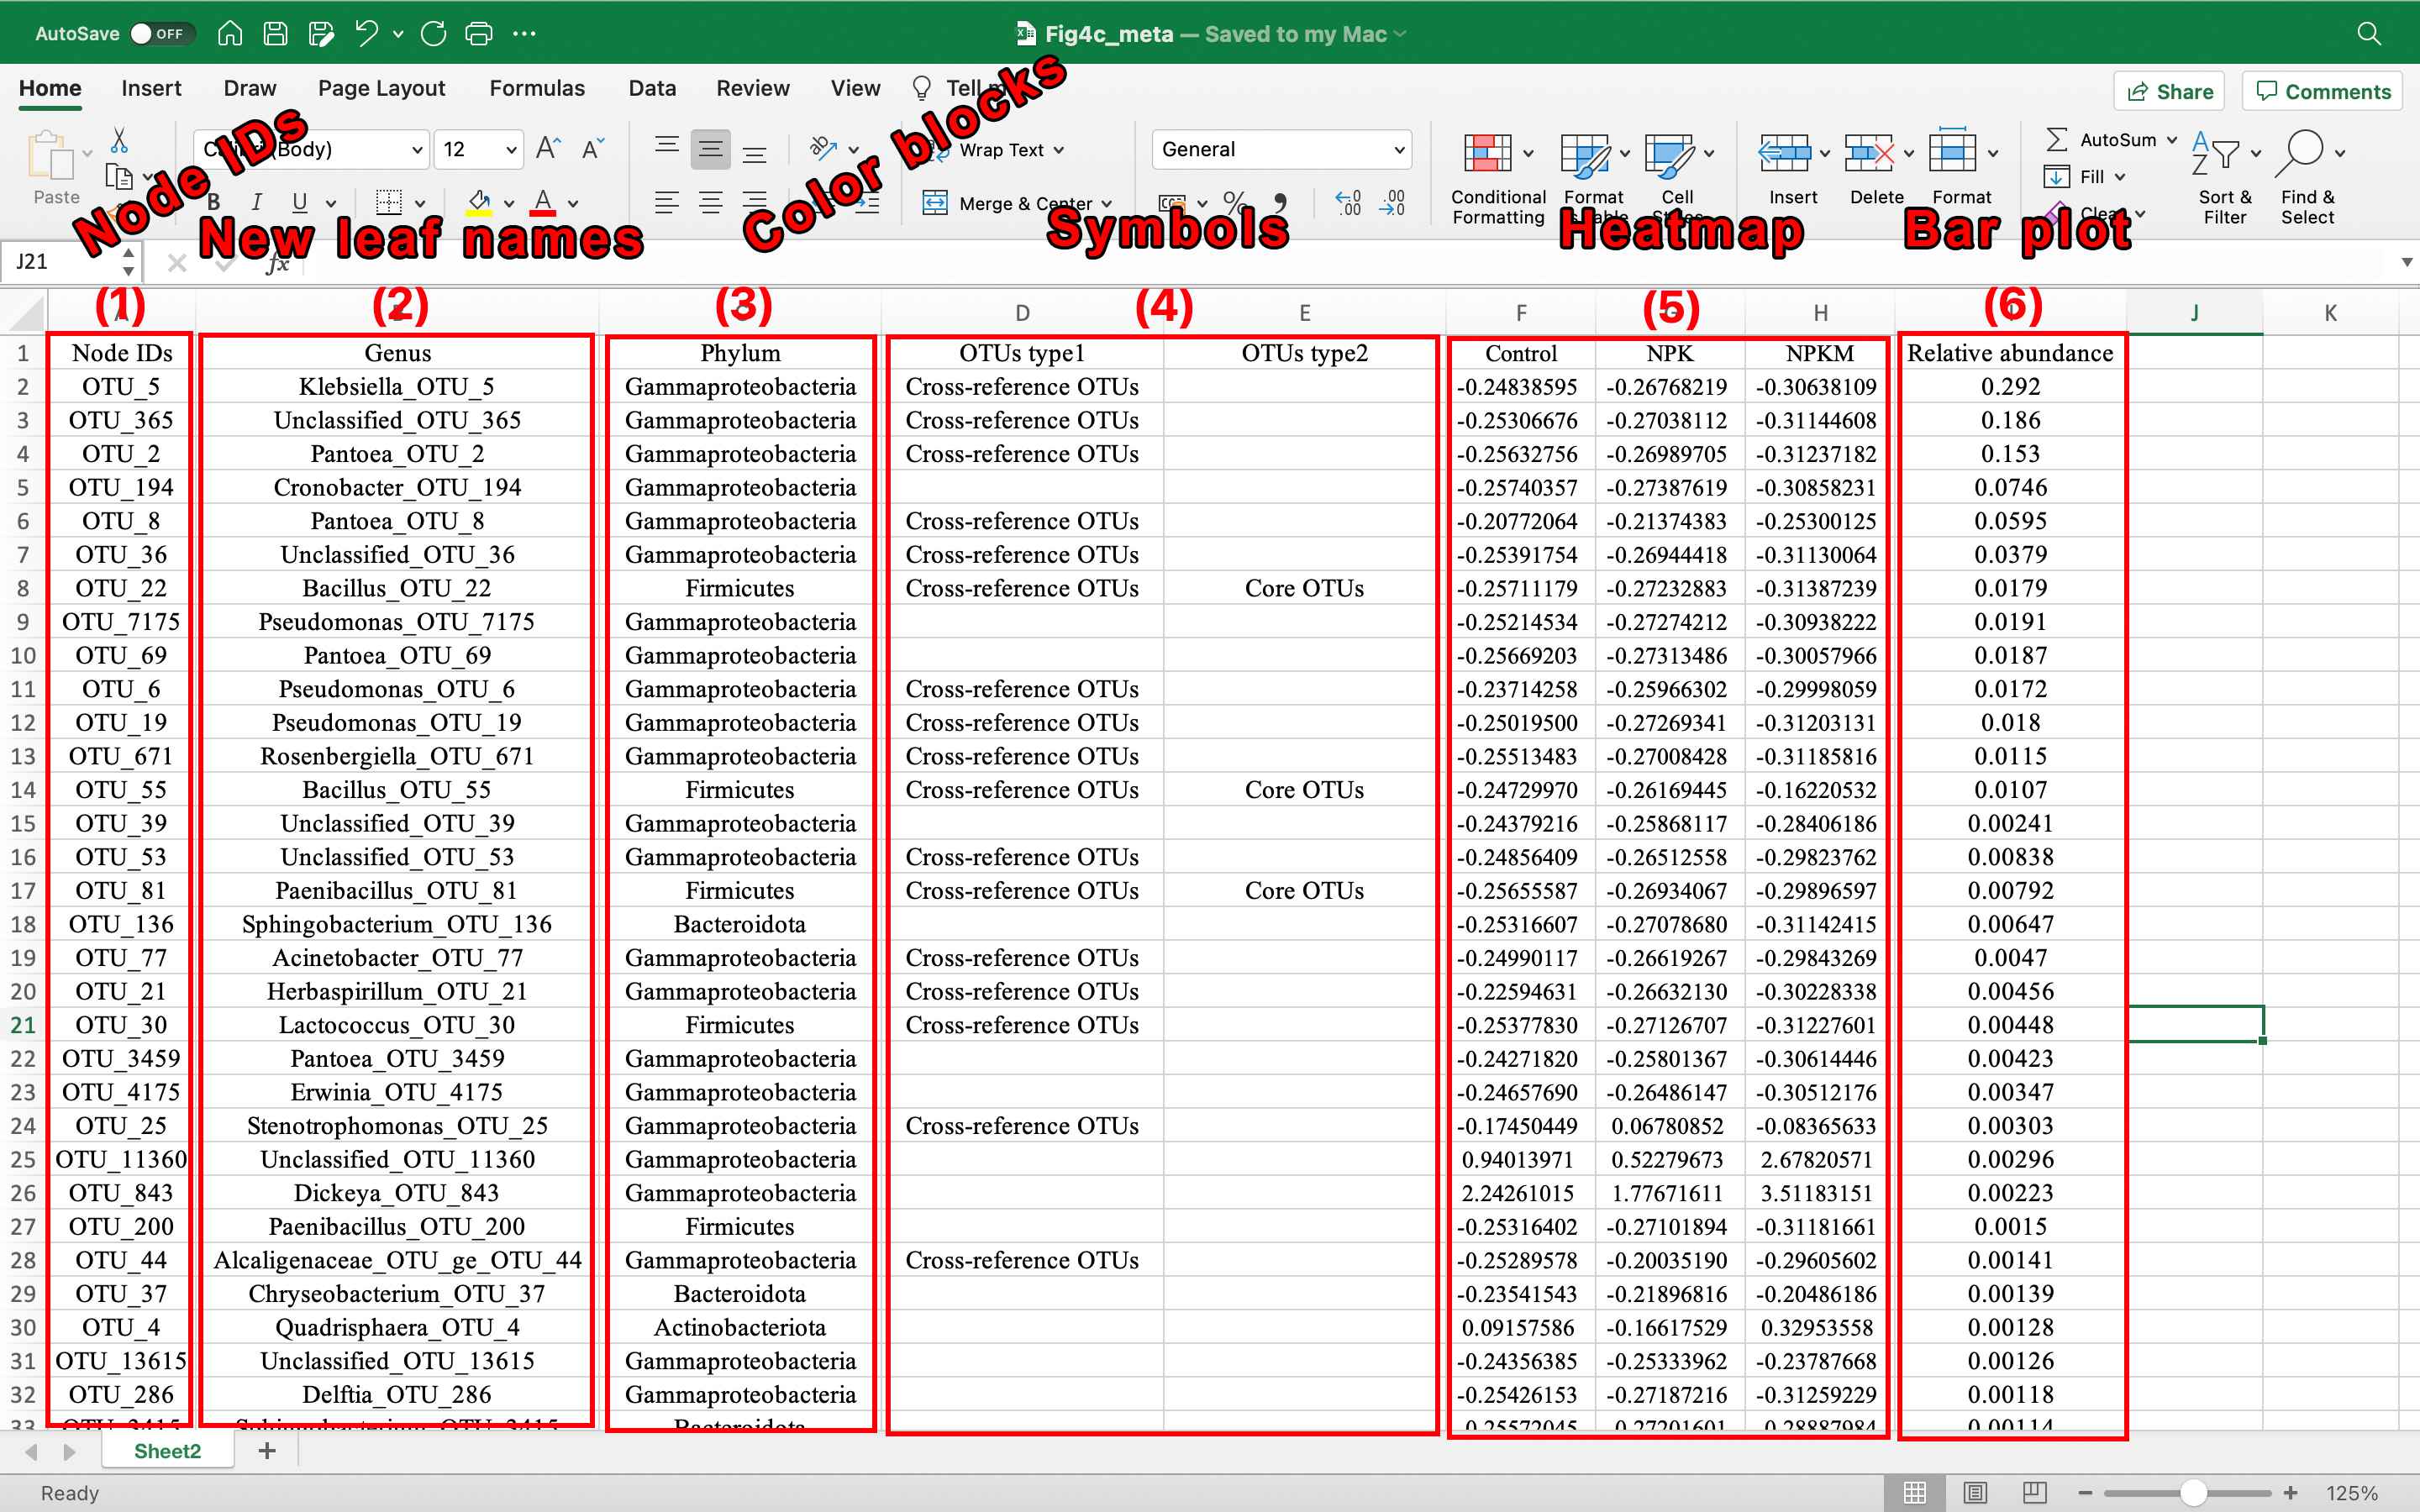
(1) The first column of each dataset layer data file must be node IDs which are identical with tree file.
-
(2) New name for dataset layer
modify leaves name. -
(3) Categories for dataset layer
color block of leaves name. -
(4) Categories for dataset layer
add symbol. -
(5) Data for dataset layer
heatmap. -
(6) Data for dataset layer
base bar plot.
Corresponding figure: View Tree
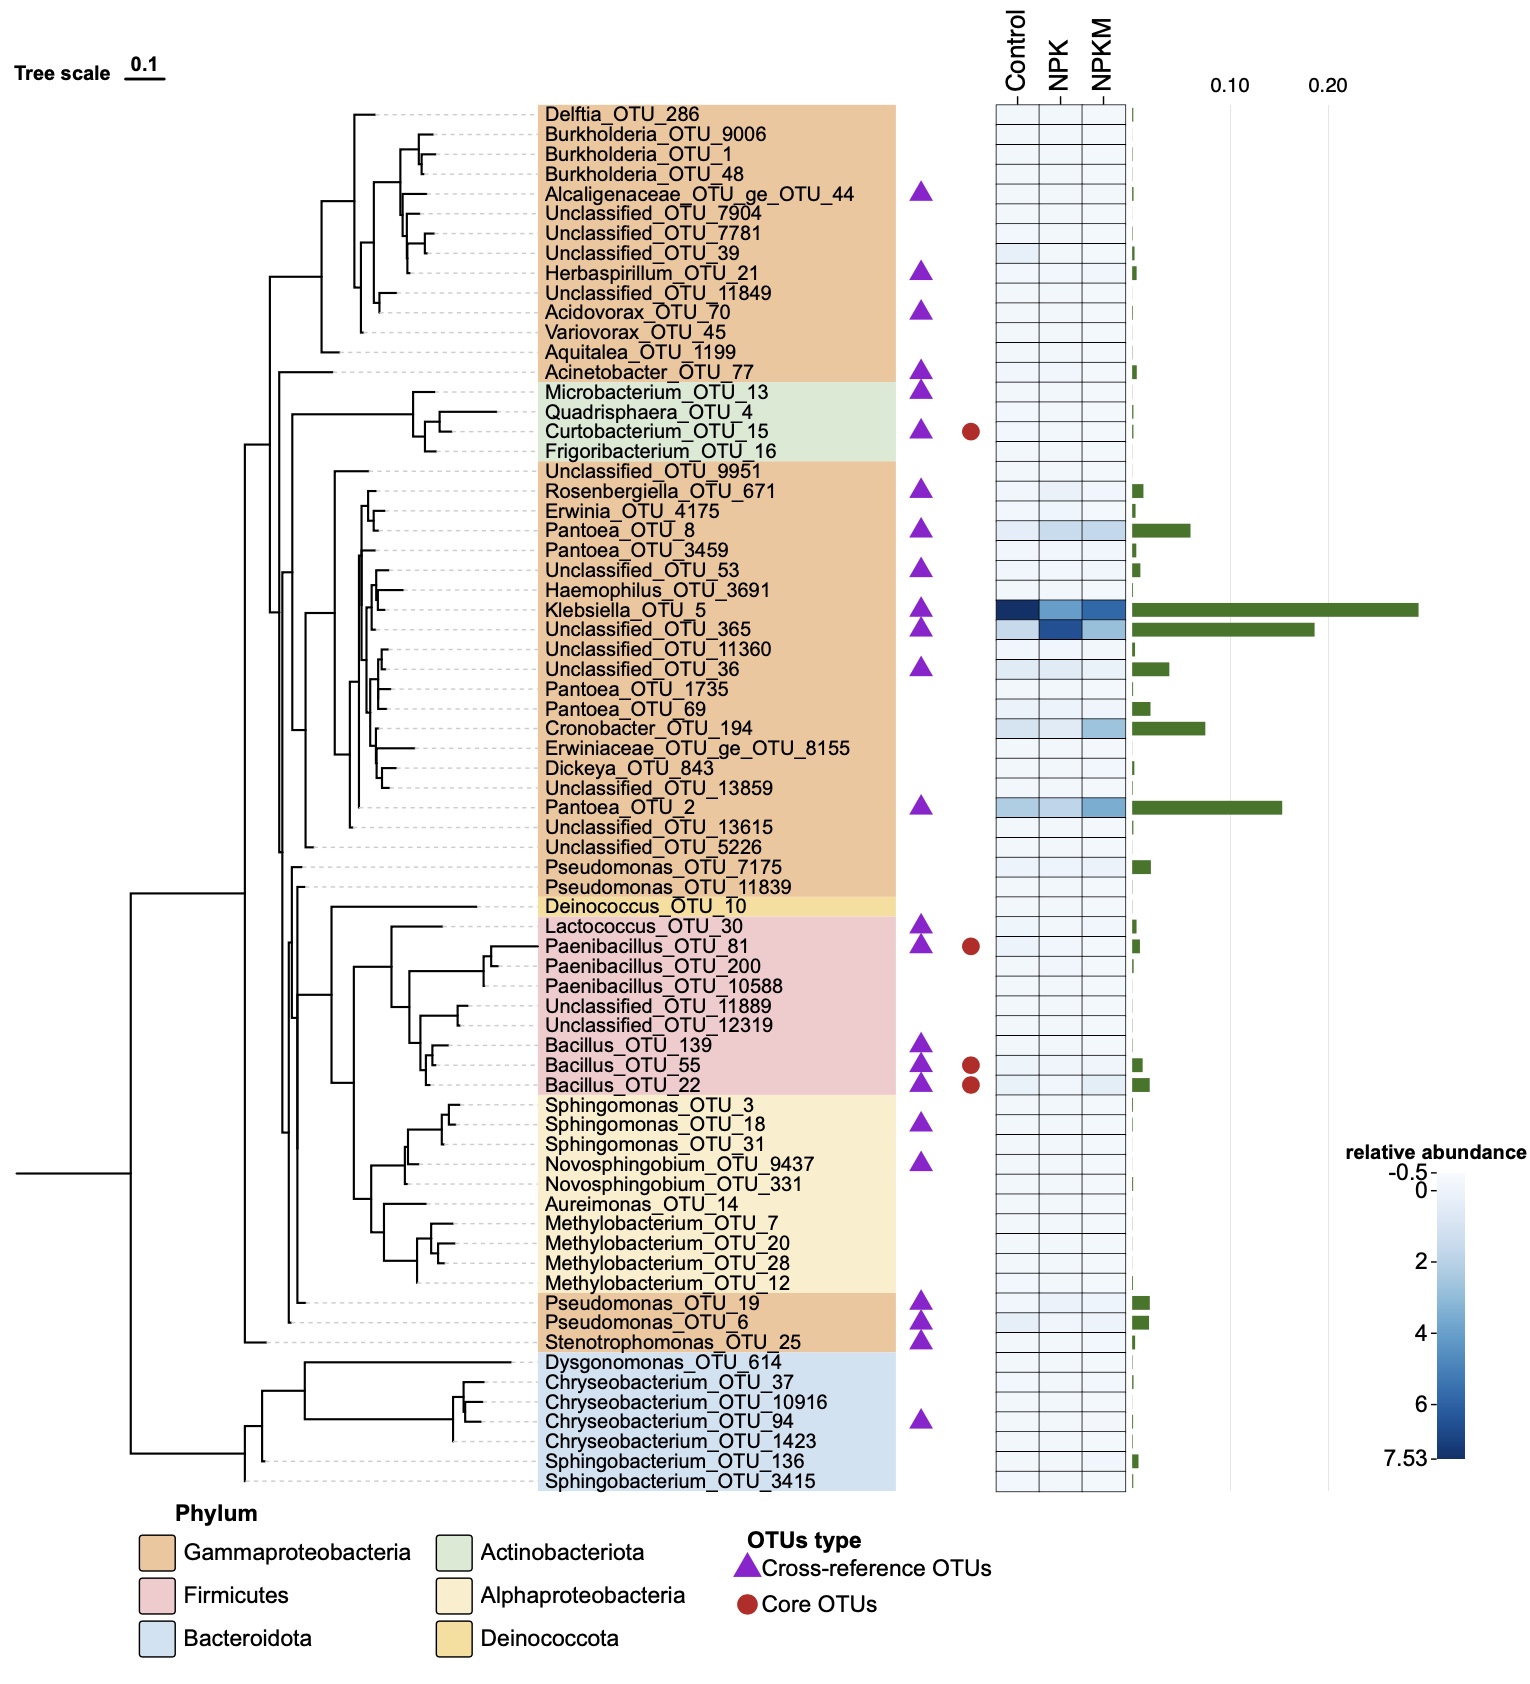
- Color blocks are added to label different Phylum.
- Two columns of symbols are added to distinguish different OTUs type.
- White and blue heatmap represents differences in relative abundance among fertilisation treatments.
- Green bar graph represents relative abundance of OTUs with a maximum value of 29.2%.
Reference: Fig. 4c Cultivation-dependent coverage of OTUs in xylem. (Zhang, L., Zhang, M., Huang, S. et al., 2022)
If you use tvBOT in your research, please cite this paper:
Xie, J., Chen, Y., Cai, G., Cai, R., Hu, Z., & Wang, H. (2023). Tree Visualization By One Table (tvBOT): a web application for visualizing, modifying and annotating phylogenetic trees. Nucleic Acids Research, gkad359. https://doi.org/10.1093/nar/gkad359