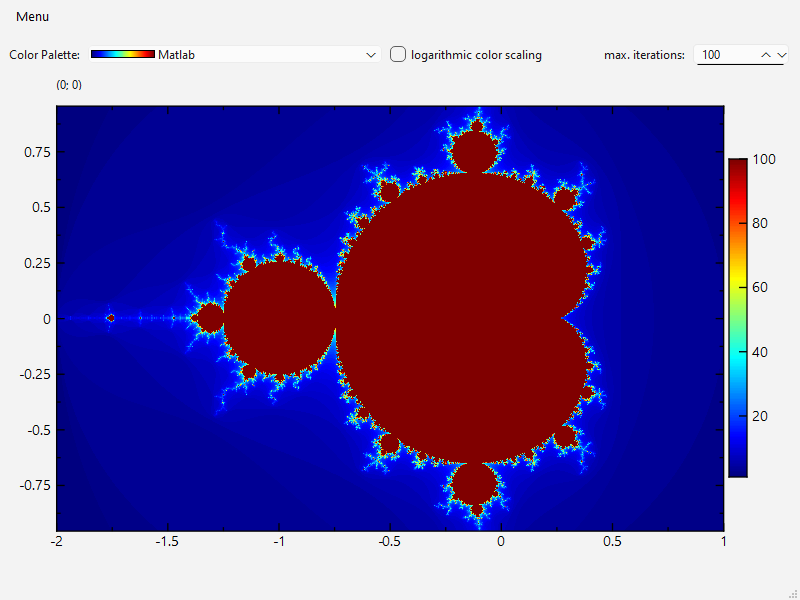
This project (see ./examples/mandelbrot/) shows how to calculate and visualize the Mandelbrot set using JKQTPlotter and its JKQTPMathImage.
The source code of the main application is (see mandelbrot.cpp:
You can use any of the several zooming methods (by mouse-wheel, panning, by drawing a rectangle ...) and the application will automaticaly calculate the zoomed area. Here is an example:
- Select the Zoom by Mouse Rectangle tool:
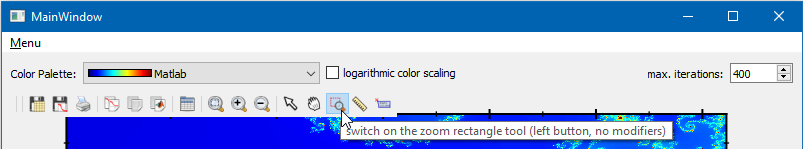
- Drag open a rectangle that you want to zoom into:
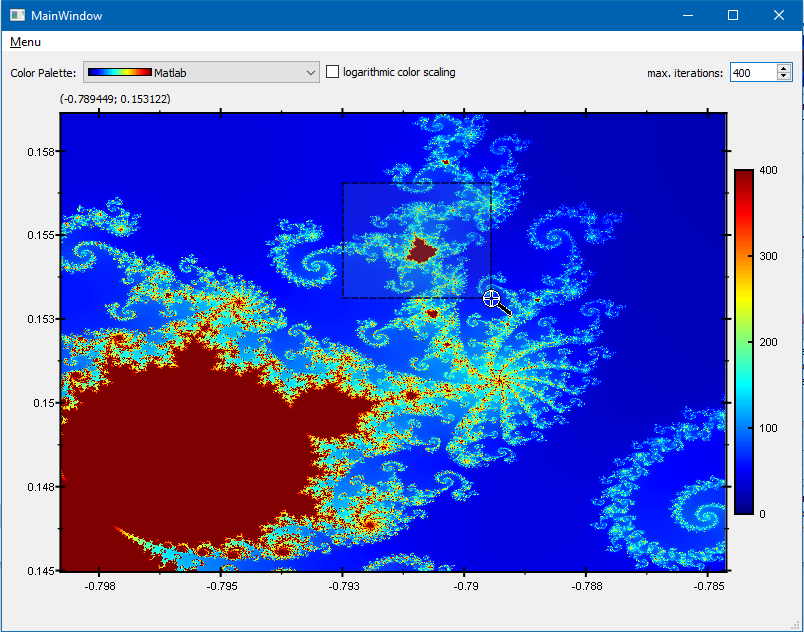
- When you release the mouse, the new image will be calculated.
In the constructor, the ui, containing a JKQTPlotter ui->plot, is initialized. Then the JKQTPlotter is set up:
    // 1. set the graph scales manually
    ui->plot->setXY(-2,1,-1,1);
    ui->plot->setAbsoluteXY(-5,5,-5,5);
    // 2. set the asxpect ratio to width/height
    ui->plot->getPlotter()->setMaintainAspectRatio(true);
    ui->plot->getPlotter()->setAspectRatio(static_cast<double>(ui->plot->width())/static_cast<double>(ui->plot->height()));
    // 3. disable grids
    ui->plot->getXAxis()->setDrawGrid(false);
    ui->plot->getYAxis()->setDrawGrid(false);
Then a JKQTPMathImage is added which displays an image column mandelbrot_col_display:
    graph=new JKQTPColumnMathImage(ui->plot);
    graph->setTitle("");
    // image column with the data
    graph->setImageColumn(mandelbrot_col_display);
    // image color range is calculated manually!
    graph->setAutoImageRange(false);
    graph->setImageMin(0);
    graph->setImageMax(ui->spinMaxIterations->value());
    // set image size
    graph->setX(ui->plot->getXMin());
    graph->setY(ui->plot->getYMin());
    graph->setWidth(ui->plot->getXMax()-ui->plot->getXMin());
    graph->setHeight(ui->plot->getYMax()-ui->plot->getYMin());
    // add graph to plot
    ui->plot->addGraph(graph);
In between thise two code blocks, two image columns are added to the internal JKQTPDatastore:
    mandelbrot_col=ds->addImageColumn(300,200, "mandelbrot_image_calculate");
    mandelbrot_col_display=ds->copyColumn(mandelbrot_col, "mandelbrot_image_display");
As mentioned before, mandelbrot_col_display is used for plotting and the baclground column (of the same size) mandelbrot_col is used to calculate a new image:
calculateMandelSet(ui->plot->getXMin(), ui->plot->getXMax(), ui->plot->getYMin(), ui->plot->getYMax(), 300, 200, ui->spinMaxIterations->value());When calculation finished, the contents of mandelbrot_col is copied to mandelbrot_col_display:
ui->plot->getDatastore()->copyColumnData(mandelbrot_col_display, mandelbrot_col);In order to implement the zoom functionality, the signal JKQTPlotter::zoomChangedLocally is connected to a function, which recalculates the new image for the new zoom-range:
void MandelbrotMainWindow::plotZoomChangedLocally(double newxmin, double newxmax, double newymin, double newymax, JKQTPlotter */*sender*/)
{
    calculateMandelSet(newxmin, newxmax, newymin, newymax, ui->plot->getXAxis()->getParentPlotWidth(), ui->plot->getYAxis()->getParentPlotWidth(), ui->spinMaxIterations->value());
    ui->plot->getDatastore()->copyColumnData(mandelbrot_col_display, mandelbrot_col);
    if (ui->chkLogScaling->isChecked()) {
        std::transform(ui->plot->getDatastore()->begin(mandelbrot_col), ui->plot->getDatastore()->end(mandelbrot_col), ui->plot->getDatastore()->begin(mandelbrot_col), &log10);
    }
    graph->setX(newxmin);
    graph->setY(newymin);
    graph->setWidth(newxmax-newxmin);
    graph->setHeight(newymax-newymin);
    // this call ensures correctly set NX and NY
    graph->setImageColumn(mandelbrot_col_display);
    ui->plot->redrawPlot();
}
The actual calculation is performed in calculateMandelSet():
void MandelbrotMainWindow::calculateMandelSet(double rmin, double rmax, double imin, double imax, size_t width, size_t height, unsigned int max_iterations) {
    QElapsedTimer timer;
    timer.start();

    auto ds=ui->plot->getDatastore();

    // ensure the image column has the correct size
    ds->resizeImageColumn(mandelbrot_col, width, height);
    qDebug()<<"calculating for "<<width<<"x"<<height<<"pixels: real="<<rmin<<"..."<<rmax<<", imaginary="<<imin<<"..."<<imax;


    //////////////////////////////////////////////////////////////////////////////////////////////////////////////////////
    // iterate over all pixels, serial code
    for (auto pix=ds->begin(mandelbrot_col); pix!= ds->end(mandelbrot_col); ++pix) {
        // calculate the pixels coordinate in the imaginary plane
        const double r0=static_cast<double>(pix.getImagePositionX())/static_cast<double>(width)*(rmax-rmin)+rmin;
        const double i0=static_cast<double>(pix.getImagePositionY())/static_cast<double>(height)*(imax-imin)+imin;
        //qDebug()<<pix.getImagePositionX()<<","<<pix.getImagePositionY()<<": "<<r0<<","<<i0;

        unsigned int iteration=0;
        double ri=0;
        double ii=0;
        // check for Mandelbrot series divergence at r0, i0, i.e. calculate
        // the series [r(i),i(i)]=fmanelbrot(r(i-1),i(i-1) | r0,i0) for every point in the plane [r0,i0]
        // starting from r(0)=i(0)=0. The number of iterations until |r(i),i(i)|>=2 gives the color of
        // the point.
        while(ri*ri+ii*ii<=2.0*2.0 && iteration<max_iterations) {
            const double tmp=ri*ri-ii*ii+r0;
            ii=2.0*ri*ii+i0;
            ri=tmp;
            iteration++;
        }
        *pix=iteration;
    }


    qDebug()<<"finished calculating after "<<static_cast<double>(timer.nsecsElapsed())/1000000.0<<"ms";
}
Here the actual algorithm to calculate the mandelbrot set is implemented. It iterates over all pixels pix in mandelbrot_col and updates their value according to the result of the calculation with *pix=iteration;.
In order to speed up the program, it actually uses a parallelized version of the algorithm:
void MandelbrotMainWindow::calculateMandelSet(double rmin, double rmax, double imin, double imax, size_t width, size_t height, unsigned int max_iterations) {
    QElapsedTimer timer;
    timer.start();

    auto ds=ui->plot->getDatastore();

    // ensure the image column has the correct size
    ds->resizeImageColumn(mandelbrot_col, width, height);
    qDebug()<<"calculating for "<<width<<"x"<<height<<"pixels: real="<<rmin<<"..."<<rmax<<", imaginary="<<imin<<"..."<<imax;


    //////////////////////////////////////////////////////////////////////////////////////////////////////////////////////
    // iterate over all pixels, parallelized version

    // calculate the block size for parallel processing
    const size_t blocksize=std::max<size_t>(100,width*height/std::max<size_t>(2, std::thread::hardware_concurrency()-1));

    std::vector<std::thread> threads;
    for (size_t offset=0; offset<width*height; offset+=blocksize) {
        threads.push_back(std::thread([=](){
            // start iterating at begin+offset
            auto pix=ds->begin(mandelbrot_col)+static_cast<int>(offset);
            // stop iterating at begin+offset+blocksize, or at the end
            const auto pix_end=pix+static_cast<int>(blocksize);
            for (; pix!=pix_end; ++pix) {
                // calculate the pixels coordinate in the imaginary plane
                const double r0=static_cast<double>(pix.getImagePositionX())/static_cast<double>(width)*(rmax-rmin)+rmin;
                const double i0=static_cast<double>(pix.getImagePositionY())/static_cast<double>(height)*(imax-imin)+imin;
                //qDebug()<<pix.getImagePositionX()<<","<<pix.getImagePositionY()<<": "<<r0<<","<<i0;

                unsigned int iteration=0;
                double ri=0;
                double ii=0;
                // check for Mandelbrot series divergence at r0, i0, i.e. calculate
                // the series [r(i),i(i)]=fmanelbrot(r(i-1),i(i-1) | r0,i0) for every point in the plane [r0,i0]
                // starting from r(0)=i(0)=0. The number of iterations until |r(i),i(i)|>=2 gives the color of
                // the point.
                while(ri*ri+ii*ii<=2.0*2.0 && iteration<max_iterations) {
                    const double tmp=ri*ri-ii*ii+r0;
                    ii=2.0*ri*ii+i0;
                    ri=tmp;
                    iteration++;
                }
                *pix=iteration;
            }
        }));
    }
    qDebug()<<"   using "<<threads.size()<<" threads with blocksize="<<blocksize;

	// wait for threads to finish
    for (auto& thread:threads) thread.join();
    threads.clear();


    qDebug()<<"finished calculating after "<<static_cast<double>(timer.nsecsElapsed())/1000000.0<<"ms";
}